

รายละเอียดสินค้า
| ข้อมูล |
น้ำหนัก
บาร์โค้ด
ลงสินค้า
อัพเดทล่าสุด
|
| รายละเอียดสินค้า |
โปรแกรมวิเคราะห์ข้อมูลและกราฟ รุ่น PQA-HiVIEW PROระบบปฏิบัติการที่รองรับ Window XP, Vista, 7สำหรับเครื่องวิเคราะห์ไฟฟ้า PW3198, 3197 และ 3196HIOKI, Japan
Analysis Capabilities Display PW3198 PW3197 PW3196 Event list TIME PLOT screens RMS (Voltage, Current, others)Voltage Harmonic and inter-harmonic fluctuations — EVENT screens Voltage waveformsCurrent waveforms Transient over voltage waveforms — High-order Harmonic Voltage waveforms — — Vector, DMM, Harmonic Graph, Harmonic List — ITIC Tolerance curve — Flicker — EVENT RMS value fluctuations Inrush Current — Demand and energy consumption EN50160 Overview, Harmonic, Measurement Results Category — Signaling — — Settings screens Specifications Compatible devices POWER QUALITY ANALYZER PW3198, 3197, 3196 Operating environment Computer running under Windows XP/Vista (32-bit), or Windows 7 (32-bit/64-bit) Screen display System, Time plot, Event list, Event data, Cursor function, Fluctuation graph of event voltage, Graph of event inrush currnet (at only PW3198, 3197), Integrated power, Demand Copy function Text data, Screen copy to clip-boad Print function Screen image, A4/ letter size, preview CSV convert function Time plot, Event waveform, Fluctuation of event voltage, Inrush current of event (at only PW3198, 3197), Flicker graph (at only PW3198, 3196), Demand, Integrated power Report Generation Auto output: RMS voltage fluctuation graph, Worst case, Maximum/ minimum value list, Voltage total harmonic distortion percentage graph, All event waveforms, Detailed list of all events, other custom output, or detailed output Only for the PW3198 and PW3196 [Screen display] Voltage, Transient waveform, Vector, DMM, Harmonic, Zero-, positive- and negative-phase calculations, Flicker graph, Cursor, High harmonic analysis orders (PW3198) [Integrated Power Calculation] Analysis period: 1 - 35 days (PW3198)/ 31 days (3196), Graph, Consumption/ regeneration value, Cursor measurement, Maximum interated power [Demand Calculation] Demand period: 5 - 30 minutes, 1 - 12 hours, Analysis period: 1 - 35 days (PW3198)/ 31 days (3196), Demand graph of consumption value, Average demand, Peak demand, Load ratio [ITIC Window] Event points are plotted on a tolerance curve (event duration versus swell, dip or interruption voltage percentage), Voltage percentage, Violation count display, Tolerance curve selection [EN50160 Screen] Classification by overview, harmonic, signaling detail (3196) or measurement results[Data Download] Via LAN [Saving settings] User-defined ITIC curves, Classification settings for measurement results, or other 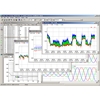 |
| เงื่อนไขอื่นๆ |
|
| Tags |
วิธีการชำระเงิน
สั่งซื้อสินค้าเรียบร้อยแล้ว รบกวนรอทางร้านติดต่อกลับ หรือแอดไลน์ LINE @onebanmor
ทางร้านยังไม่ได้ทำการเพิ่มบัญชีรับเงิน กรุณาติดต่อ เจ้าของร้าน
 onebanmor หนึ่งอีเล็คโทรนิค
สมัครสมาชิกร้านนี้ เพื่อรับสิทธิพิเศษ
สินค้าในตะกร้า ({{total_num}} รายการ)

ขออภัย ขณะนี้ยังไม่มีสินค้าในตะกร้า
ราคาสินค้าทั้งหมด
฿ {{price_format(total_price)}}
- ฿ {{price_format(discount.price)}}
ราคาสินค้าทั้งหมด
{{total_quantity}} ชิ้น
฿ {{price_format(after_product_price)}}
ราคาไม่รวมค่าจัดส่ง
➜ เลือกซื้อสินค้าเพิ่ม